What makes a city truly livable? Is it clean air, access to healthcare, public green spaces, or good waste management? Most would agree it's a combination of many factors—but capturing all these elements in a single, easy-to-understand measure is no small task. That’s where the Liveable Cities Index, developed by Cetaqua, comes in.
Developed as a decision-support tool, the Liveable Cities Index offers a data-driven method to evaluate and compare the habitability of cities. By integrating public data across environmental, health, social, resource, and land use dimensions, the tool helps policymakers, municipalities, and urban planners pinpoint both strengths and areas needing improvement. It’s not just about ranking cities; it’s about supporting more sustainable and equitable urban development.
Understanding urban habitability
Urban habitability reflects the well-being of a community today and into the future. It’s a concept that includes environmental, economic, social, and health-related aspects of urban life. The Liveable Cities Index embraces this holistic view, turning complex data into meaningful insights that guide action.
The idea behind the index is simple: aggregate multiple indicators across key categories to produce a composite score for each city. But beneath that simplicity is a robust methodology grounded in public data and transparent calculations.
How it works
The Liveable Cities Index is based on data from 2019 (which can be updated in accordance with the update frequency of the underlying databases) and includes 80 indicators grouped into five major categories:
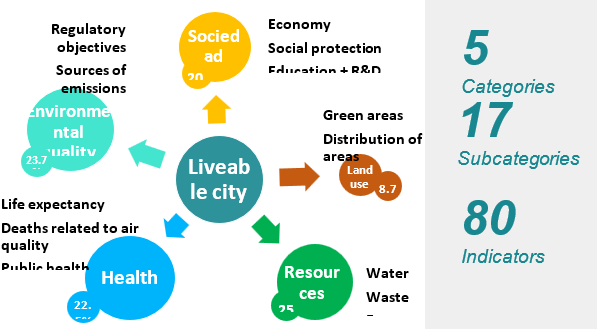
Each category contains subcategories such as air quality, waste management, public healthcare, education, transportation, green space access, and more. The data is normalized using the Z-score method—this ensures that cities are compared on an even playing field—and aggregated using symmetric weights so that each category contributes fairly to the overall score.
To ensure accuracy and transparency, all indicators are adjusted to reflect rates per 100,000 inhabitants or per capita. Data sources include official entities like Spain’s INE (National Statistics Institute), MITECO, Copernicus, and other public databases, alongside inputs from municipalities and regional governments.
Building the Index: A technical perspective
Creating the index involves several key steps:
- Selection of Relevant Indicators: Chosen for feasibility, relevance, and potential for automation.
- Data Aggregation: Collected data is transformed into comparable formats (rates), normalized, and aggregated.
- Disaggregation: The overall score can be broken down by category or subcategory to reveal deeper insights.
- Automation & Replicability: Much of the data collection process is automated, enabling scalability and consistency.
The result is a fully transparent, replicable system capable of expanding to more cities or adapting to specific local needs.
Key results
The index has been applied to 25 cities so far, producing a ranking that highlights both high performers and areas for improvement:
- Top Performers:
Gavà, Calvià, and Barcelona rank highest overall, with Gavà leading in Land Use thanks to its extensive transportation infrastructure and balanced green space.
Barcelona excels in Resources and Society, with strong performance in waste management and education/research.
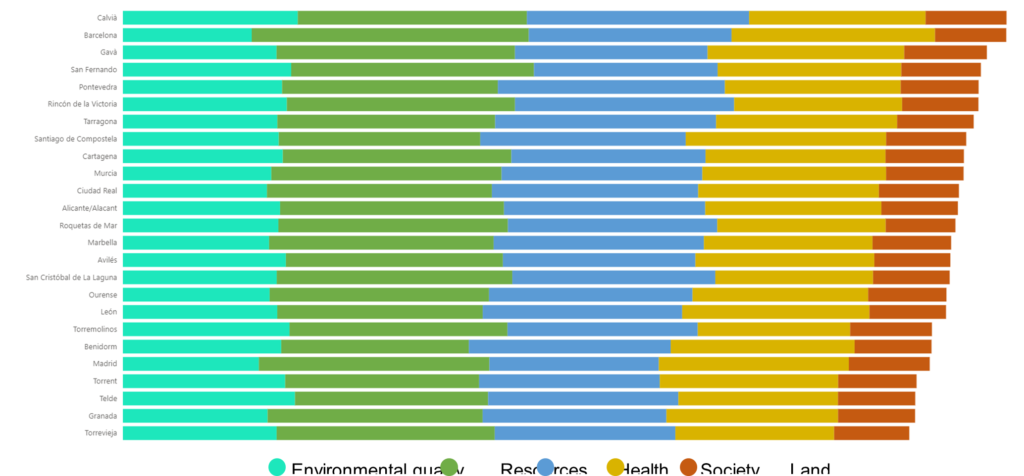
- Environmental Challenges:
Cities like Madrid and Barcelona fall behind in Environmental Quality, largely due to poor air quality and high per capita emissions.
- Health & Society:
Medium and small-sized cities perform better in Health, reflecting stronger public healthcare systems and fewer pollution-related deaths.
Barcelona and Santiago lead in Society, driven by investment in social protection and R&D.
These insights are not just numbers—they are actionable. Cities can use this information to make targeted improvements, develop new policies, and measure the impact of their interventions over time.
Why it matters
The Liveable Cities Index goes beyond creating a simple ranking. It opens the door to:
- Customized Support: Cities can request tailored calculations at district or neighborhood levels.
- Strategic Planning: Municipalities can adapt categories to reflect their local priorities and use their own data to refine the results.
- Broader Goals: The methodology can align with national strategies like Spain’s Urban Agenda and Sustainable Development Goals (SDGs).
Ultimately, this tool allows for more informed decisions that can improve the lives of citizens and foster sustainable growth.

Funded by the European Union. Views and opinions expressed are however those of the author(s) only and do not necessarily reflect those of the European Union or the European Climate, Infrastructure and Environment Executive Agency (CINEA). Neither the European Union nor the granting authority can be held responsible for them. This project has received funding from the Horizon Innovation Actions under the grant agreement n° 101096405.